Understanding Layoff Trends: A Data-Driven Approach to Workforce Planning
Introduction
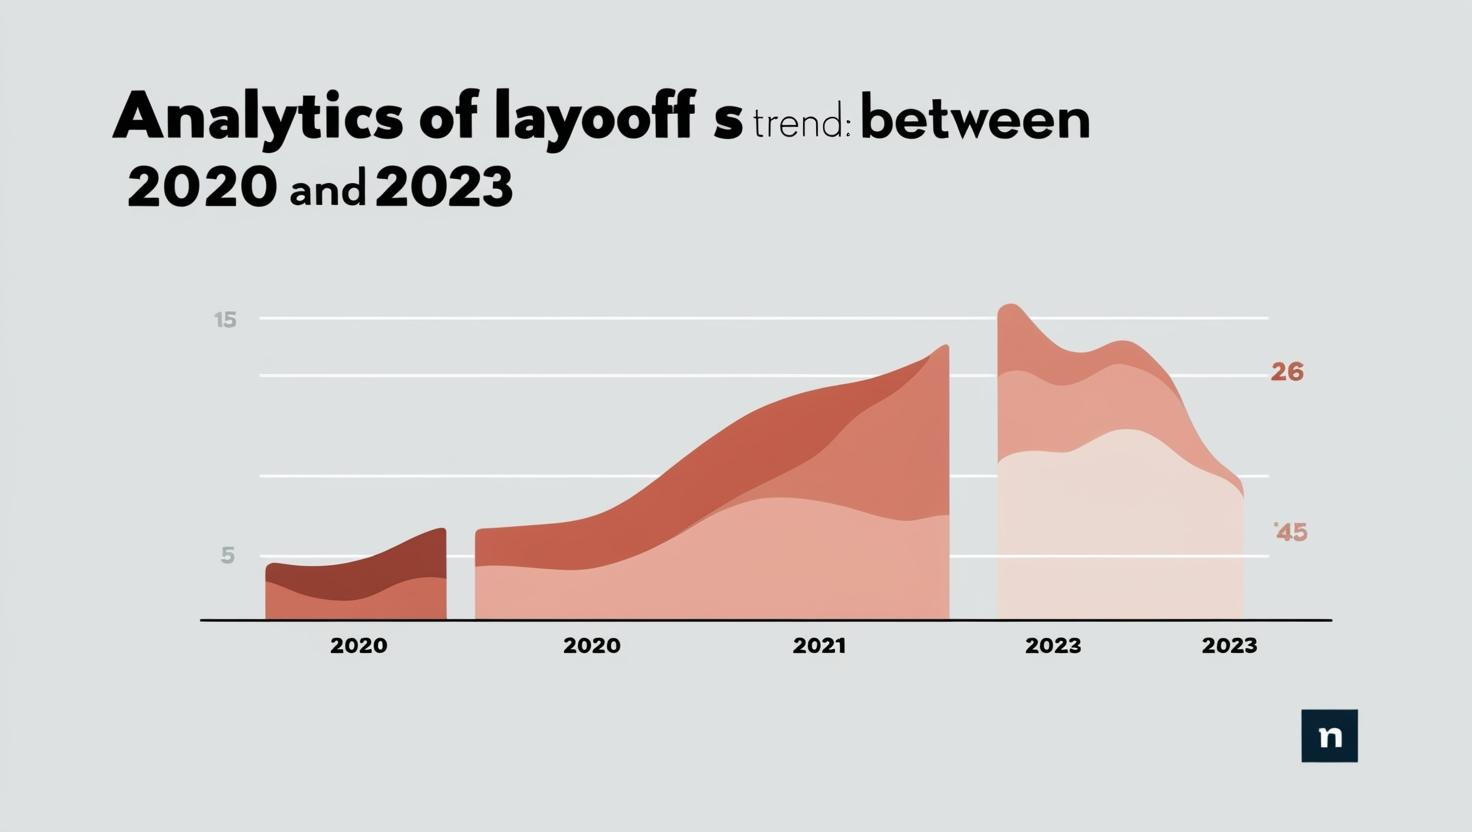
In today’s volatile economic landscape, layoffs have become a critical issue for companies worldwide. From post-pandemic adjustments to industry-specific disruptions, organizations are navigating uncertain waters. Data-driven decision-making and advanced analytics offer businesses the tools they need to mitigate risks, optimize resources, and plan proactively.
This article explores layoff trends from 2022 to Q2 2024, leveraging raw data to uncover actionable insights.
Through systematic data cleaning, analysis, and advanced metrics like the Layoff Severity Index, we aim to provide strategies that help organizations forecast and prepare for workforce challenges effectively.
Data Collection & Exploration
Source Identification
Data collection is the cornerstone of effective analysis. For this project, we utilized publicly available datasets in CSV and Excel formats, this was a sample dataset available on Kaggel. The entire article is driven from this dataset.
Tools like SQL Workbench and Python were employed to process and prepare the data for deeper analysis.
There are multiple tools available in market for collection of data some of them are Python Scripts, Web Scrapping tools , API integration to mention the few which are widely used by the audience.
There can be challenges or obstacles one can encounter during data collection, sometimes the data can be made up or does not carry any clean data set . So be careful which dataset you choose.
Initial Exploration
To begin understanding the dataset, a basic description of the table was performed using SQL Workbench. This step provided an overview of the columns, data types, and the number of records in the table.
It is critical to validate the data types during this phase, as conversions from other formats (e.g., Excel to CSV) can occasionally result in numeric fields (such as floats) being stored as text. This mismatch can lead to errors or unexpected results when applying formulas or calculations.
Observations from Initial Exploration:
- Several fields in the dataset contain blank or null values.
- Key fields required for calculations are stored as text instead of numeric data types.
- Some columns are irrelevant to the scope of this case study and may need to be excluded.
- Certain columns exhibit unexpected patterns or anomalies in the data.
- Critical data such as Pincode and State information is missing in several records.
Data Profiling
Data profiling involves visualizing key aspects of data distribution and providing summary statistics, such as mean, median, and standard deviation, for relevant columns.
Before performing these calculations, it is essential to identify the columns that are appropriate for these measures, focusing on those with continuous numerical values.
Column Selection
The selection process involves ensuring contextual relevance, identifying meaningful columns for analysis. For example, metrics like "Laid Off" and "Company Size Before Layoff" are particularly suitable for this type of statistical evaluation.
Statistical Measures
- Interpret the Mean: The mean represents the average value, providing insight into overall trends.
- Interpret the Median: The median reflects the middle value, which is especially valuable for understanding data distribution, particularly in skewed datasets.
- Interpret the Standard Deviation: This metric indicates the spread of values around the mean, offering insights into variability within the dataset.
Application
Field-level calculations of mean, median, and standard deviation were performed on the "Laid Off" column in the raw data.
This analysis provides a clear understanding of data spread, aiding in statistical interpretation and subsequent decision-making.
Data Cleaning and Preparation
Importance of Data Cleaning
Data cleaning is a critical step in ensuring the accuracy and reliability of any analysis. The quality of insights derived from data is directly proportional to the quality of the dataset itself. Skewed or erroneous data can lead to misleading outcomes and poor decision-making, making this step essential.
Steps Taken for Data Cleaning
- Handling Missing Values: Rows with missing values in critical fields were removed to maintain the dataset’s integrity and ensure accurate analysis.
- Resolving Inconsistent Data:
- The field "Money Raised in Millions" was stored as text. Queries were executed in SQL to convert this field to a numeric (float) format for proper calculations.
- Similarly, date-related fields saved as text were converted to date and time formats to enable accurate temporal analysis.
- Addressing Null and Blank Values:
- A comprehensive review of all columns was conducted to identify and quantify null and blank values (e.g., empty strings or spaces).
- Rows containing significant null or blank entries were removed to enhance the dataset’s accuracy and reliability.
By implementing these measures, the dataset was transformed into a clean, structured, and reliable format, ready for meaningful analysis.
Data Validation
Validation Checks
Performing data validation checks is an essential step to ensure the quality, accuracy, and consistency of your dataset before analysis or modeling. Below is a structured approach to validation processes:
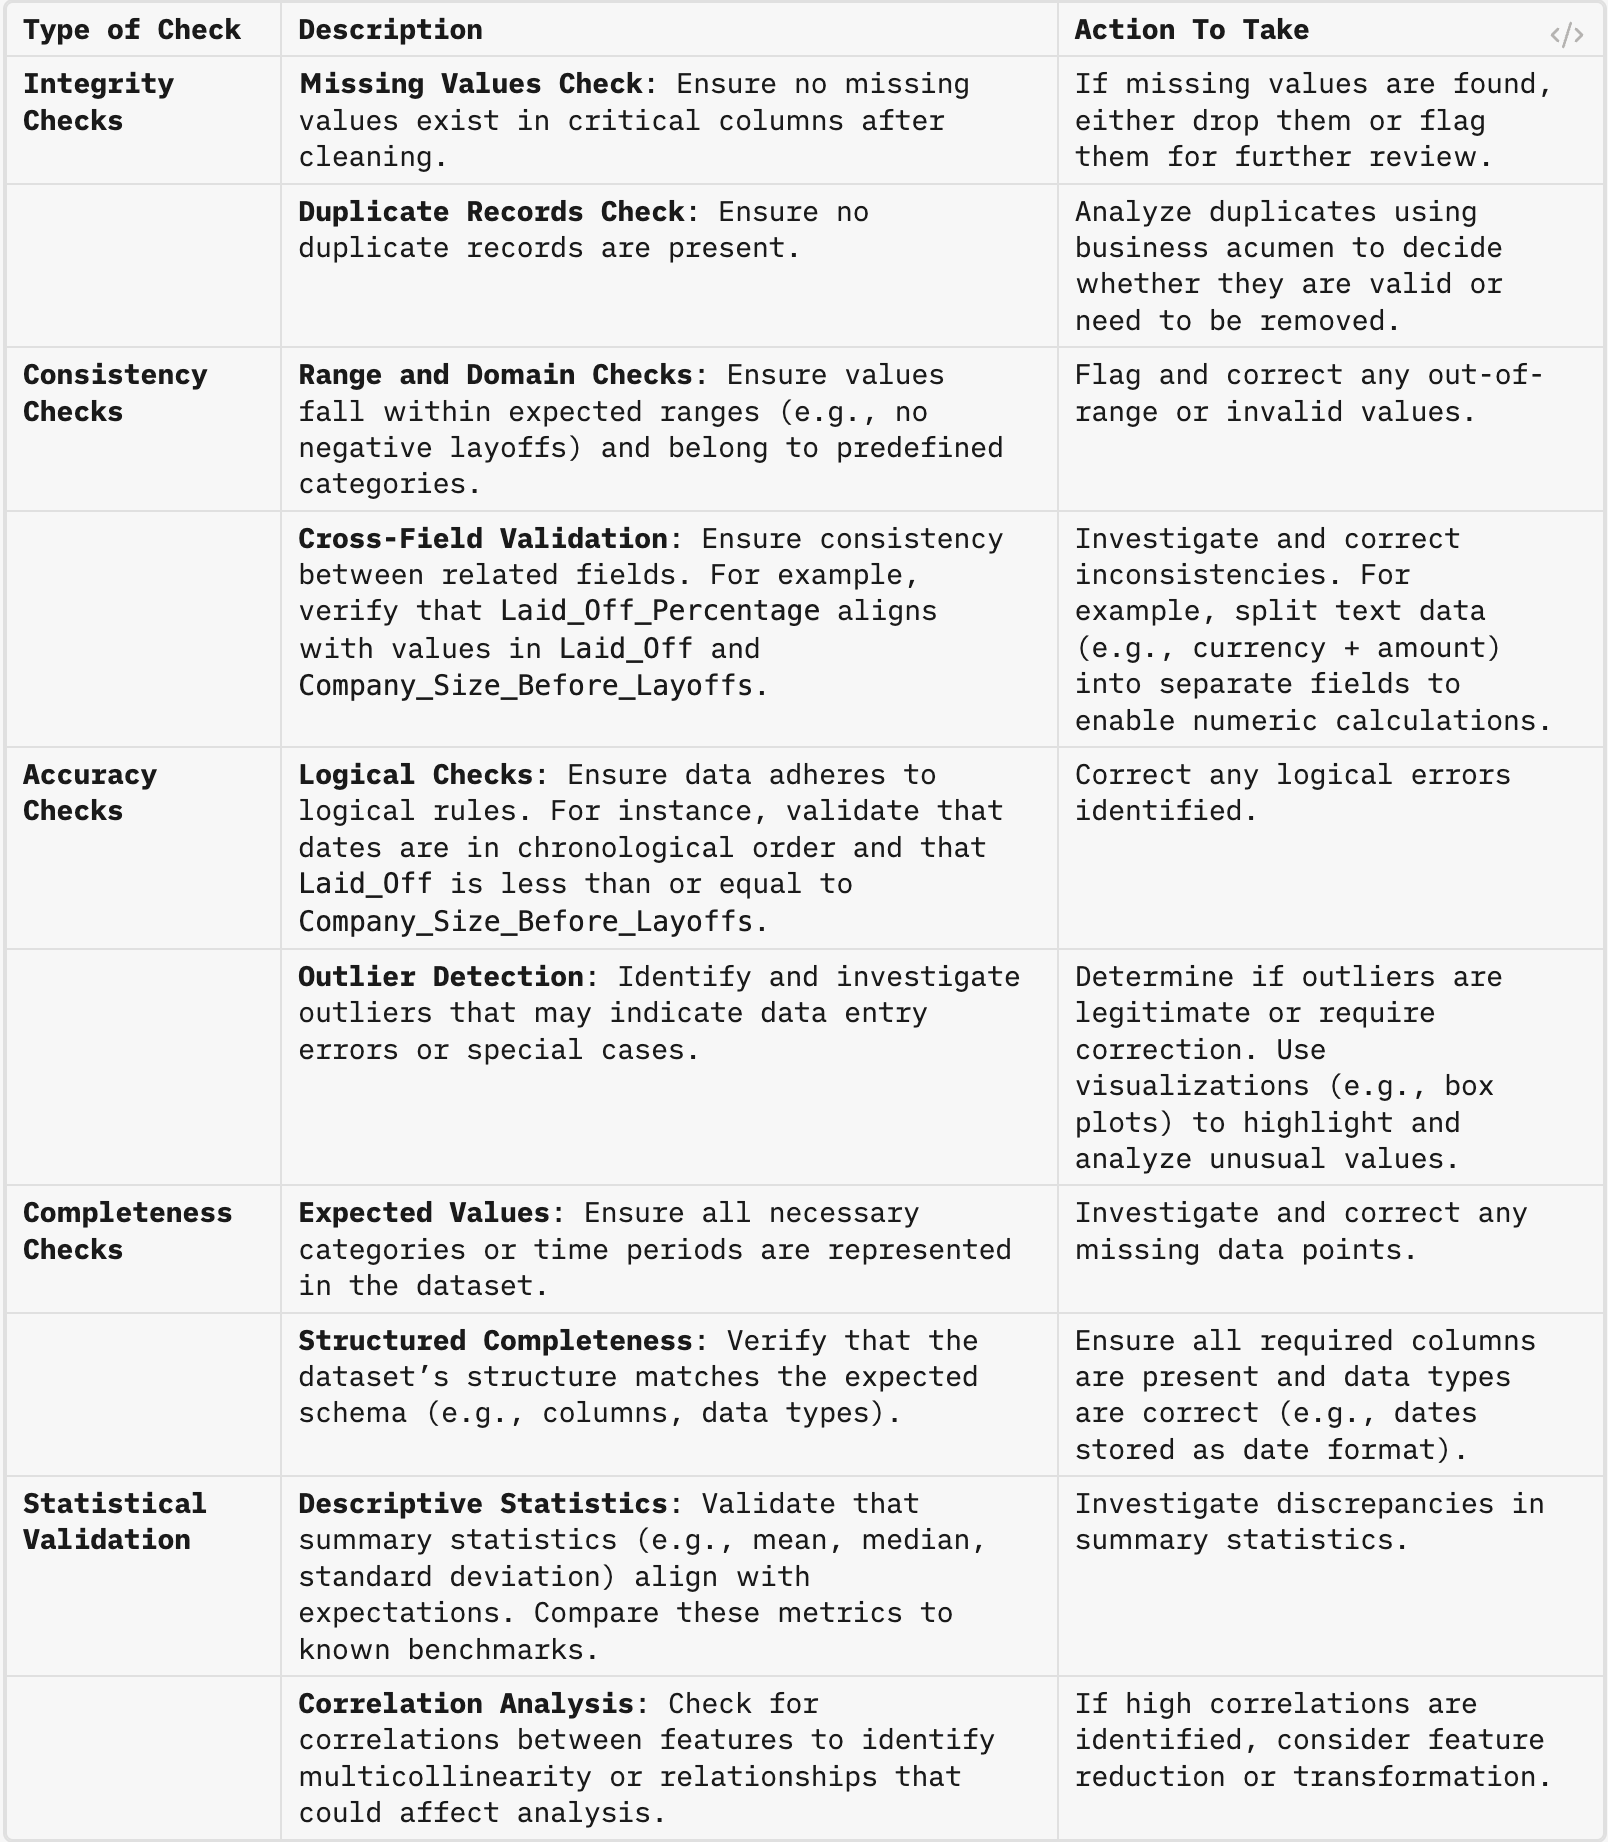
By adhering to these validation steps, you can ensure your dataset is accurate, consistent, and reliable, minimizing errors and improving the credibility of your insights.
Key Metrics and Analytical Framework
These ket Metrics were calculated and stored to feed into the data analytics.
1. Layoff Severity Index
Objective: Quantify the impact of layoffs by combining multiple factors like workforce size and funding.
- Formula:
Layoff Severity Index = (Laid_Off_Percentage * (Company_Size / Median_Company_Size)) * Funding_Per_Employee - Use Case: Rank companies based on layoff severity to identify those at risk of deeper operational issues.
2. Percentage of Workforce Laid Off
Objective: Understand the relative impact across companies of different sizes.
- Formula:
(Laid Off / Company Size Before Layoffs) * 100 - Use Case: Benchmark industry performance and assess operational efficiency.
3. Funding Per Employee
Objective: Evaluate financial efficiency by correlating funding with workforce size.
- Formula:
Funding Per Employee = Money_Raised / Company_Size - Use Case: Identify companies with financial instability despite significant funding.
Data Analysis and Insights
Data analysis and visualization form the cornerstone of deriving actionable insights from raw data. This section highlights the key objectives and techniques used to uncover meaningful patterns.
Exploratory Data Analysis (EDA)
Leverage advanced visualizations to explore relationships, identify patterns, and reveal trends within the dataset.
Key Analyses:
Layoff Trends by Geography
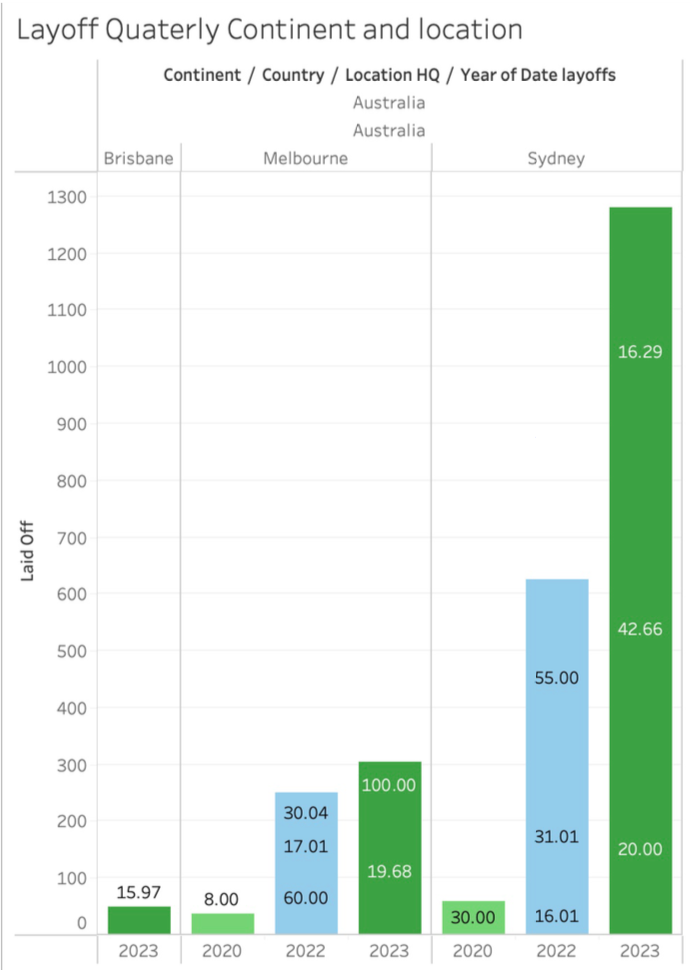
- This analysis provides a detailed view of layoffs segmented by continent, country, and city. Understanding regional variations helps identify areas most impacted by economic disruptions.
Industry-Specific Layoff Analysis
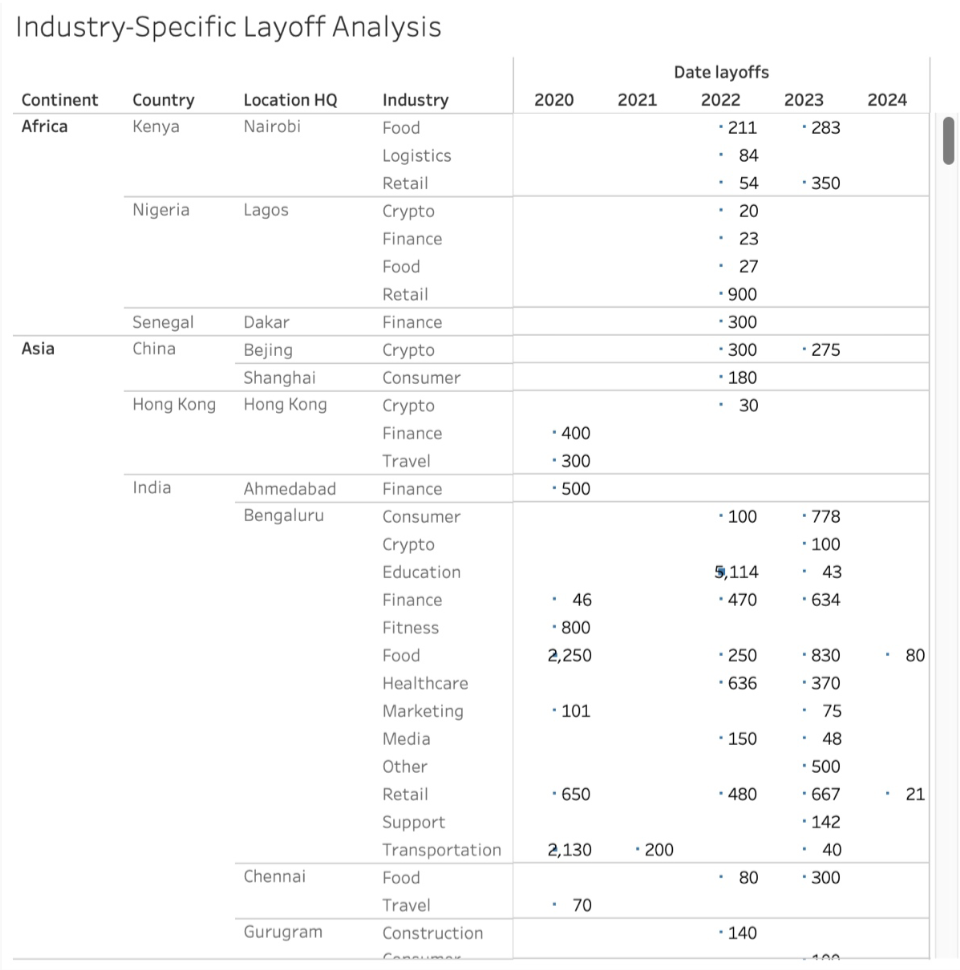
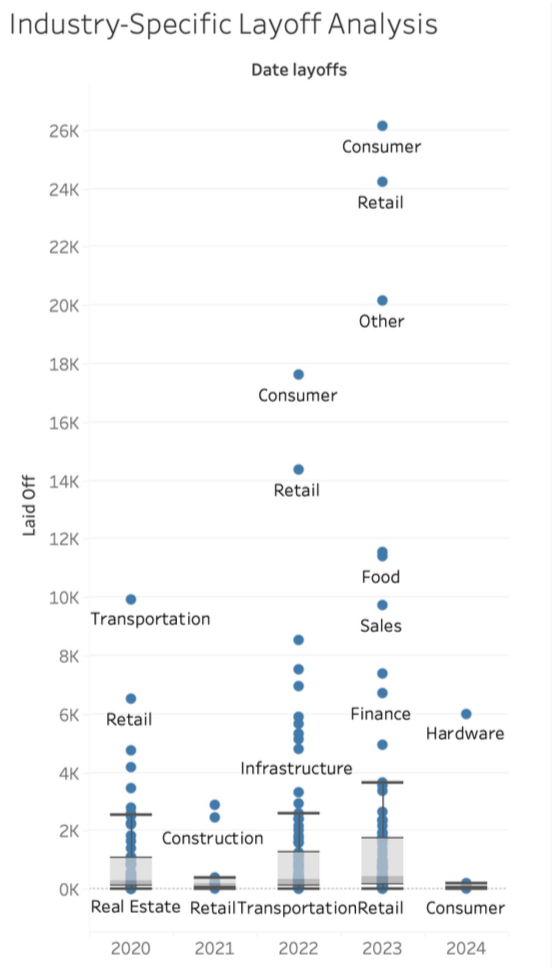
- This focuses on identifying which industries faced the hardest hits during layoffs, allowing for industry-specific strategic planning and resource allocation.
Temporal Layoff Report

- A time series analysis uncovers trends and seasonal patterns in layoffs, providing insights into periodic economic fluctuations and workforce adjustments.
Company Stage Analysis

- This comparison highlights layoff trends across companies at different stages of growth (e.g., Pre-IPO vs. Post-IPO), shedding light on how organizational maturity affects workforce dynamics.
Financial Health vs. Layoffs Report

- By correlating layoffs with financial metrics such as funding raised, this report identifies thresholds or patterns that indicate financial distress leading to layoffs.
- The graph highlights the importance of workforce management tailored to company size. It suggests that while larger firms are more prone to large-scale layoffs, smaller companies can experience disproportionate layoffs relative to their size, especially in volatile industries. Strategic workforce planning and cost optimization are key to mitigating these risks.
Pattern Identification
Financial Health vs. Layoffs Report
- Pattern Identification:
- There is a general trend showing that companies with larger sizes before layoffs tend to have higher layoffs.
- Some outliers indicate companies with relatively smaller sizes had significant layoffs, suggesting possible financial instability or industry-specific challenges.
- Findings:
- Companies with a high number of layoffs relative to their size might indicate deeper operational issues or a failure in scaling.
- The correlation observed could be due to larger companies being more vulnerable to economic downturns or shifts in market demands, leading to more substantial layoffs.
Temporal Layoff Report
- Pattern Identification:
- Layoffs have occurred in spikes, with significant peaks at certain times, particularly in 2023.
- The layoffs have been quite inconsistent, with some periods showing almost no layoffs and others showing very high numbers.
- Findings:
- The spikes may correspond with broader economic events or industry-wide disruptions (e.g., the post-pandemic adjustment in 2022-2023).
- Seasonal patterns or external factors like market crashes, regulatory changes, or technology shifts might influence these trends.
Company Stage Analysis
- Pattern Identification:
- Layoffs are more prevalent in companies at the Post-IPO stage, with fewer layoffs occurring in earlier stages like Seed or Series A.
- There seems to be a rise in layoffs as companies mature, peaking post-IPO.
- Findings:
- Companies might be cutting back after going public due to increased scrutiny from investors and the pressure to maintain profitability.
- Early-stage companies are likely more cautious with hiring and do not lay off as frequently due to smaller workforce sizes or because they are still in growth phases.
Layoff Quarterly Continent and Location
- Pattern Identification:
- There is significant variability in layoffs across different cities and quarters, with some locations like Sydney showing very high layoff numbers, particularly in 2023.
- The geographical distribution indicates that certain areas may be more susceptible to layoffs due to local economic conditions or industry concentrations.
- Findings:
- The concentration of layoffs in specific cities could suggest regional economic issues, such as downturns in dominant industries within those areas.
- The trends may also highlight global supply chain issues or market dependencies affecting certain regions more than others.
Conclusion and Recommendations:
- Industry and Economic Sensitivity: The layoff patterns strongly correlate with external economic conditions, suggesting that both global and local economic factors need to be closely monitored.
- Company Stage Considerations: Companies at different funding stages face different challenges, and these should be considered when making workforce-related decisions. Post-IPO companies need careful planning to avoid significant layoffs that could harm market confidence.
- Geographical Insights: Regional analyses reveal that specific cities or countries might need more robust contingency plans to handle economic downturns or industry shifts that could lead to layoffs.
Further Analysis:
- Causal Analysis: A deeper look into the causes behind the layoffs during peak periods, especially in 2023, could provide actionable insights.
- Predictive Modeling: Using the current data, a predictive model could be developed to forecast potential future layoffs based on economic indicators, company size, and funding stages.
- Comparative Industry Analysis: Comparing layoffs across different industries could help understand if certain sectors are more vulnerable to economic changes.
These findings can be used to inform strategic decisions, improve company resilience, and better prepare for future economic challenges.
Unlock Insights for Future Decision-Making
We offer tailored analytics and workforce planning solutions to help your organization navigate complex challenges.
Free Consultation: Book Now
Audit your data to gain deeper insights and future-proof your strategies with our tailored solutions.
Book Free ConsultationInteractive Dashboard
Access a customizable Tableau dashboard for real-time insights tailored to your business needs.
Future-Proof Strategies
Stay ahead of industry trends with actionable data insights and tailored analytics solutions.